Batu Kawan Berhad's (hereafter called "BKAWAN") principal activities including investment holdings, oil palm plantation, chemicals manufacturing, money lending, general transportation services, letting of storage warehouse facilities, manufacture and sale of methyl chloride and manufacture of sulphuric acid products. Kuala Lumpur Kepong Berhad's (hereafter called "KLK") principal activities including the business of plantation, producing and processing palm products and natural rubber on its plantations, manufacturing, retailing, property development and investment holding. BKAWAN is major shareholder of KLK, holding 46.57% equity interests at financial ended 31 September 2011.
Side-by-side Comparison
Capitalization
Measure by size, KLK was a lot bigger than BKAWAN, almost 4 times the size of BKAWAN.
Income Items
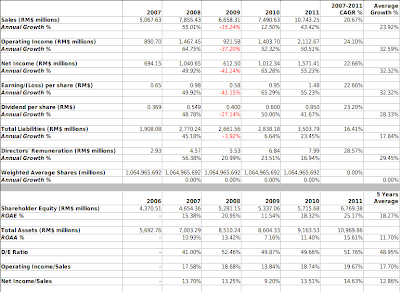
Important items under this section is per share earnings and dividend, BKAWAN is all time winner in per share earnings and dividend.
Balance Sheet Items
Both BKAWAN and KLK have very solid balance sheet, their Current assets is more than enough cover their Total liabilities. But BKAWAN is better, as it's Cash or cash equivalents is more than enough cover the Current liabilities and close to cover the Total liabilities.
Ratios
Price-wise, BKAWAN is much more attractive at the moment given it sell at much lower multiple of earnings currently compared to KLK. The Net income/sales of BKAWAN is meaningless here given over 90% of it's profit before tax was contributed by it's key associate, KLK.
Earning growth rate in both companies in near-term and long-term are very much parallel due to the reason mentioned in previous sentence. These numbers is not applicable to MSC as it experienced significant loss in 2010.
Price Record
BKAWAN has much higher price growth rate in the near-term where KLK has higher price growth rate in the long-term.
Financial Summary
As over 90% pre-tax profit of BKAWAN was contributed by KLK, the title of this post is more appropriate to named as "Batu Kawan Berhad and Kuala Lumpur Kepong Berhad" instead of "Batu Kawan Berhad vs. Kuala Lumpur Kepong Berhad". When you invest into BKAWAN, you are largely invest into KLK. Let's look into financial summary of both companies as usual.
 |
| BKAWAN's Financial Summary |
 |
| KLK's Financial Summary |
Given today's closing price of both BKAWAN and KLK, the market capitalization of BKAWAN is 7,725 millions and KLK is 26,240 millions, 46.57% of KLK is currently valued at 12,220 millions. By invest into BKAWAN with today quotation, you are taking 36.78% discount to invest into KLK indirectly.
As conclusion, BKAWAN is the winner of this comparison due to it's lower valuation and favorable reason above.
How Much BKAWAN Worth?
Given the company CAGR of EPS is 18% (approximately 22.3% in the past 5 years) and Dividend Per Share is 15% in the next 10 years, the EPS of the company will be RM$2.44 in 2021 (included adjustment of 2 bad years in 10 which reduce 50% of group's net profit) and the forecast dividends received over the 10 years period totaling RM$9.11 (included adjustment of 2 bad years).
If the stock price of BKAWAN sell at 10 times earning in 2021, it is RM$24.40 and included total dividends received, it is RM$33.52 per share. Given annual 6% inflation rate in next 10 years, the discounted rate is 0.591898. So, RM$33.52 discounted to today price, it is RM$19.84 per share.
The discounted price is 6.85% lower comparing to today (06 January 2012) closing price RM$18.48. In my opinion, the stock is only discounted in narrow margin, what do you think?


